Figure 2.
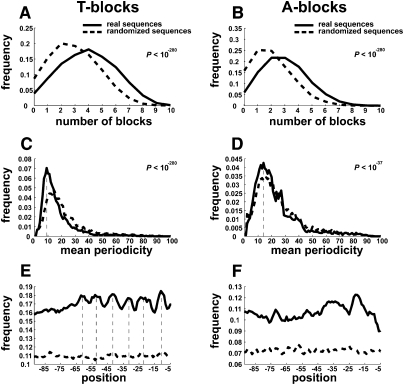
Occurrences and periodicity of the T-blocks motif in core promoters. (A,B) Distributions of T/A-blocks per gene, respectively. A block of a given nucleotide is defined as three or more occurrences of that nucleotide. The overall number of blocks is computed as the number of nonoverlapping 10-bp windows containing the blocks (see Methods). (C,D). Distributions of mean periodicity for all genes. For each gene, the mean distance between T-blocks was calculated (see Methods). The random plot corresponds to the mean periodicity in randomly permutated sequences. The observed plot for T-blocks (left) indicates a periodicity with a mode of nine, while A-blocks show a periodicity of 15 (vertical dashed lines). (E,F). Locations of T-blocks and A-blocks along the core promoter. For each location, the fraction comprising T/A-blocks is shown. Random sequences are computed as in C and D. A periodicity of 10 bp is found in the −60 to −10 region (vertical dashed lines). Indicated P-values relate to differences between the distributions.

