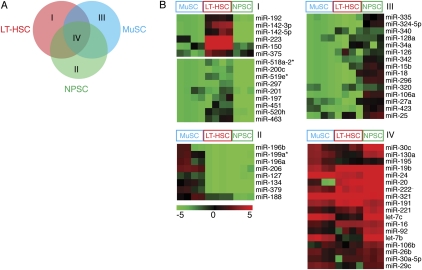
Figure 2.
Identification of tissue-specific stem cell–related miRNA signatures. (A) Schematic diagrams illustrate the comparisons made to reveal the tissue-specific SC-related miRNA signatures: I, miRNAs enriched in LT-HSCs (LT-HSC miRNAs); II, miRNAs enriched in NSPCs (NSPC miRNAs); III, miRNAs enriched in MuSCs (MuSC miRNAs); and IV, the common SC miRNA signatures (SC-related miRNAs). They are depicted as the single-colored regions (I, II, III) and a triple-colored region (IV) in the Venn diagram. (B) Heatmaps depicting common and tissue-specific miRNAs derived from KMC analyses. A false color scale was used to indicate normalized arbitrary expression intensity (ΔCt) with “−5” for the lowest expression, “0” for median expression, and “5” for the highest expression.

