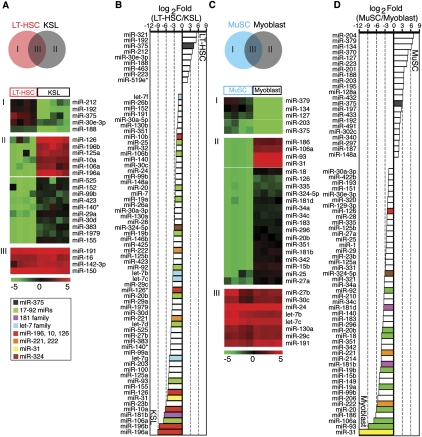
Figure 3.
miRNAs differentially expressed in LT-HSCs and KSL cells and in MuSCs and myoblasts. (A) Schematic diagram depicting the comparisons made to reveal miRNAs that are expressed in LT-HSCs only (I), expressed in KSL cells only (II), or highly expressed in both (III). SAM analyses were carried out to identify miRNAs that were significantly different or unchanged between LT-HSCs and KSL cells (FDR < 0.001), which were then further classified by KMC analyses as depicted in heatmaps. A false color scale was used to indicate the normalized arbitrary expression intensity (ΔCt). (B) Fold changes in the top 69 miRNAs that differed significantly between LT-HSCs and KSL cells (SAM, FDR < 0.001) are shown (Log2 Fold [LT-HSC/KSL]). (C) Schematic diagram depicting the comparisons made to reveal miRNAs that are expressed in MuSCs only (I), expressed in myoblasts only (II), or highly expressed in both (III). SAM analyses were carried out to identify miRNAs that were significantly different or unchanged between MuSCs and myoblasts (FDR < 0.001), which were then further classified by KMC analyses as depicted in heatmaps. A false color scale was used to indicate the normalized arbitrary expression intensity (ΔCt). (D) Fold changes in the top 69 miRNAs that differed significantly between MuSCs and myoblasts (SAM, FDR < 0.001) are shown (Log2 Fold[MuSC/myoblasts]). Selected miRNAs or groups of miRNA are color-coded. The miR-181 family miRNA consists of miR-181a, miR-181b, miR-181c, and miR-181d. The miR-17-92 family miRNA clusters consist of miR-17-92, miR-106b-25, and miR-106a-363. The let-7 family consists of let-7a-i.

