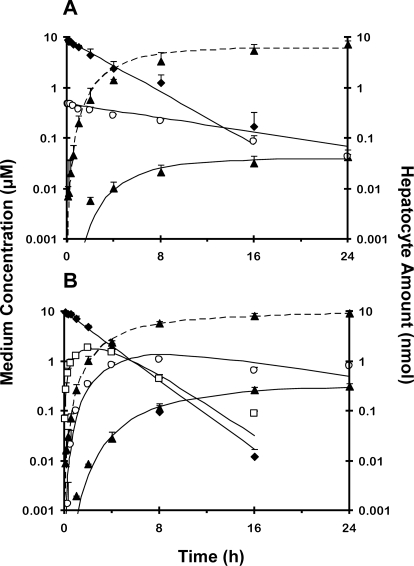
Fig. 5.
Disposition of prodrugs pafuramidine (A) and CPD-0868 (B) and corresponding metabolites over 24 h in day-4 sandwich-cultured rat hepatocytes. Prodrug (10 μM) was administered as a bolus to each well, which contained 1.5 ml of culture medium. ♦, prodrug; □, M1; ○, M3; ▴, active metabolite. Symbols and error bars denote means and SDs, respectively, of n = 2 livers in duplicate. Solid lines represent medium concentration-time profile of prodrug and derived metabolites. Dashed lines represent hepatocyte amount-time profile of active metabolite. Solid and dashed lines represent the computer-generated best fit of the pharmacokinetic model depicted in Fig. 2 (model 1) to the data. Pafuramidine contained 5 to 10% impurities, primarily M3; M1 from pafuramidine is not included in A because of low recovery in medium, as described under Results.

