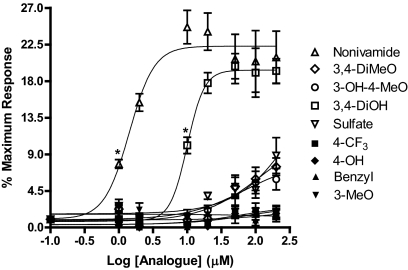
Fig. 3.
Dose response curves for calcium flux in TRPV1-OE cells treated with capsaicinoid analogs: nonivamide (▵), N-(3,4-dihydroxybenzyl)nonanamide (□), N-(3-hydroxy-4-methoxybenzyl)nonanamide (○), 3-methoxy-4-(nonamidomethyl)phenyl sulfate (▿), N-benzylnonanamide (▴), N-(3-methoxybenzyl)nonanamide (▾), N-(3,4-dimethoxybenzyl)nonanamide (◊), N-(4-trifluoromethylbenzyl)nonanamide (●), and N-(4-hydroxybenzyl)nonanamide (♦). Statistically significant calcium flux, p < 0.05 by one-way ANOVA, was observed for nonivamide and the 3,4-DiOH analog at concentrations equal to and greater than as indicated by *. Data are represented as percentage of response relative to ionomycin ± S.E.M. (n ≥3).

