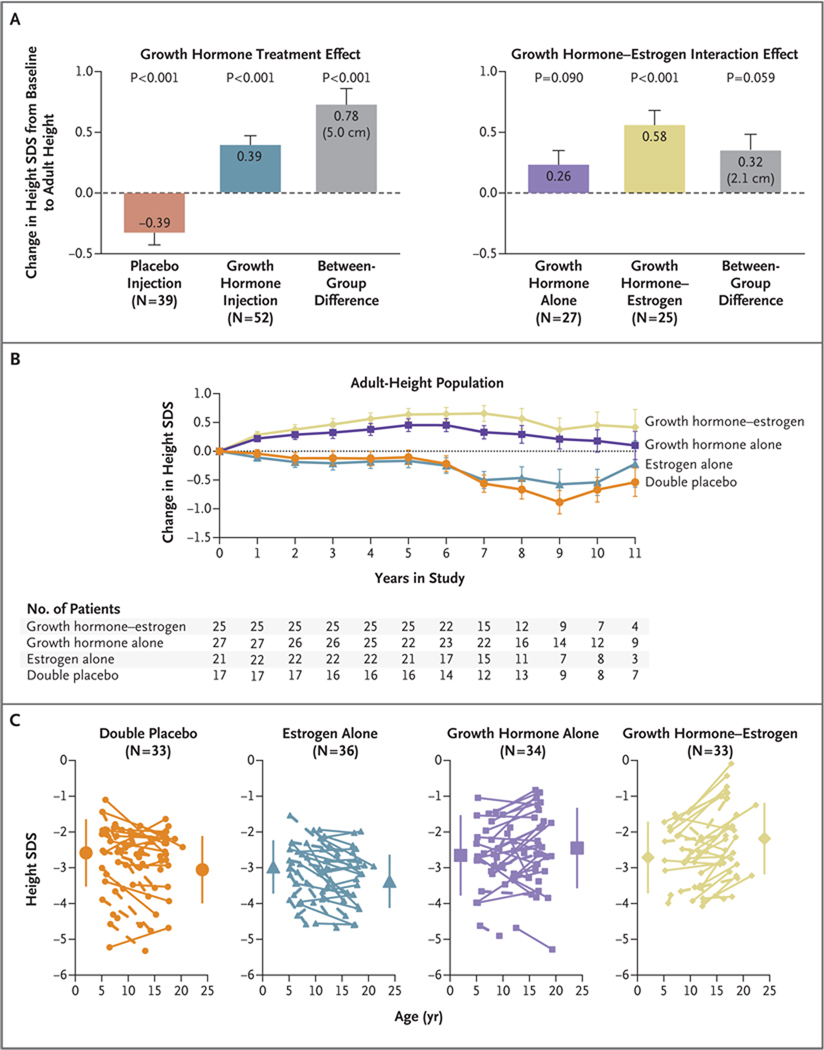
Figure 3. Effects of Treatment on Adult Height.
In Panel A, the graph on the left shows the growth hormone treatment effect on adult height. The observed treatment effect (least-squares mean [±SE] difference in the change in standard-deviation score [SDS] from baseline to adult height, 0.78±0.13 [equivalent to 5.0 cm], on the basis of analysis of covariance [ANCOVA]) results from the combined effects of the gain in the height SDS observed in the groups treated with growth hormone and prevention of the height SDS loss observed in the placebo injection groups. The graph on the right shows the effects of the interaction of growth hormone and childhood estrogen therapy. The mean between-group difference (growth hormone plus estrogen vs. growth hormone plus placebo) of 0.32±0.17 in the SDS change (equivalent to 2.1 cm) represents the incremental effect of childhood low-dose estrogen in combination with growth hormone. The graph in Panel B shows the change in the height SDS from baseline for the adult-height population according to number of years in the study. Annual data points represent the ANCOVA least-squares mean (±SE) values, with baseline age and baseline height SDS as covariates. Changes above the horizontal line represent gains in the SDS for height; changes below the horizontal line represent decreases in the SDS for height. In the adult-height population, the groups treated with growth hormone had consistent increases in height for the first 5 years of the study, whereas the groups that received placebo injections had progressive declines in height SDS. Panel C shows the changes in the SDS for height from baseline to the last available height measurement for individual patients in the intention-to-treat population. Solid lines represent patients with adult-height measurements, and dashed lines patients without adult-height measurements. One patient in the estrogen-alone group who received surreptitious growth hormone during the study is not included. Large symbols represent the group means (±SD) at baseline and at the time of the last height measurement. Mean baseline SDS and end-point SDS in the four groups were as follows: double-placebo group, −2.59±0.96 and −3.08±0.95; estrogen-alone group, −3.01±0.74 and −3.40±0.74; growth hormone–alone group, −2.65±0.91 and −2.45±1.13; and growth hormone–estrogen group, −2.71±0.81 and −2.18±1.00 (P<0.001 for the comparison among the four groups). Individual gains in the height SDS for patients with adult-height measurements (i.e., change in height SDS from baseline to adult height >0) were observed for 15% of patients in the double-placebo group, 32% in the estrogen-alone group, 65% in the growth hormone–alone group, and 79% in the growth hormone– estrogen group (P<0.001 for the comparison among the four groups).

