FIGURE 4.
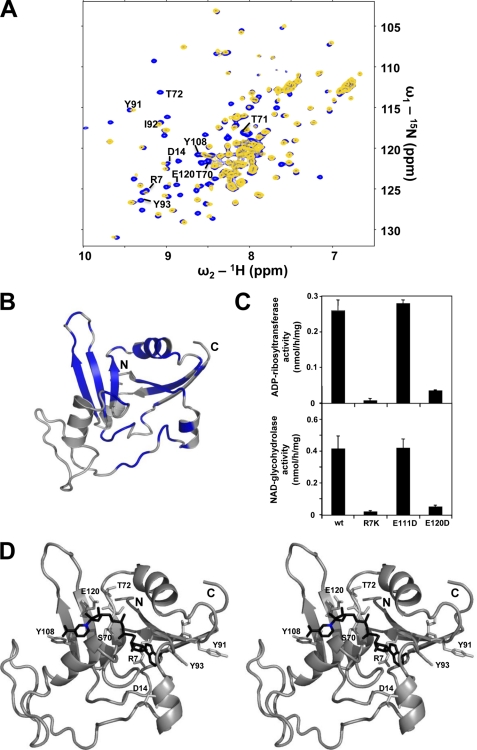
Characterization of the NAD binding site. A, superposition of the 1H-15N-HSQC spectra of NarE (blue) and NarE containing an excess of β-Nicotinamide-adenine-dinucleotide (NAD) (yellow). B, residues with NMR signals attenuated by more than 50% or showing a combined chemical shift perturbation Δδcomb > 0.03 ppm corresponding to a remarkable signal shift after addition of NAD are mapped in blue onto the NarE. C, site-directed mutagenesis of Arg-7 and Glu-120 residues results in a drastic reduction of both ADP-ribosylation activity (upper panel) and NADase activity (lower panel). The enzymatic activity of NarE was assayed by monitoring both the transfer of ADP-ribose to agmatine and the release of nicotinamide, as described under “Experimental Procedures.” Bars indicate the standard deviations of three individual chambers. Repeated experiments gave similar results. D, model of NAD (black) bound to NarE obtained with the HADDOCK webserver in stereo representation (7). Residues affected by NAD binding and conserved within the ADPRT family are highlighted. The nicotinamide nitrogen nucleophilically attacked by Glu-120 is marked blue.

