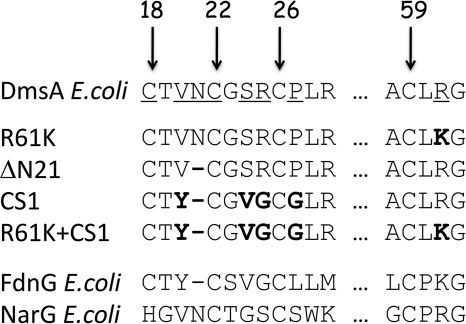
FIGURE 2.
Sequences of DmsA mutants in comparison with Cys group sequences of FdnG and NarG. Numbers indicate the positions of four conserved Cys residues in the mature protein sequence. The amino acid residues that were mutated for this study are underlined. In the sequences of the mutants, the resultant residues of mutation are shown in boldface. The sequences of E. coli FdnG, a typical Type I enzyme, and E. coli NarG, a typical Type II enzyme, are also shown for comparison.

