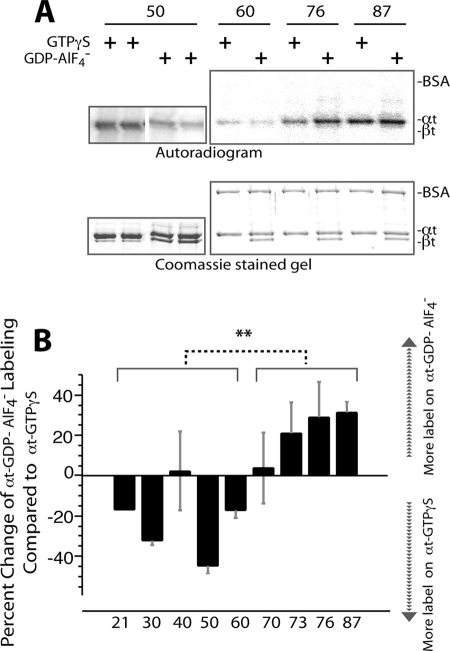
FIGURE 4.
Comparison of label transfer to αt-GTPγS and to αt-GDP-AlF4− from the same PDEγ position. Photocross-linking/label transfer experiments with [125I]ACTP-PDEγ and αt were conducted as described previously (13) (also see “Experimental Procedures”). The same batch of [125I]ACTP-PDEγ photoprobes reported previously (13, 19) was used in this study. The same [125I]ACTP-PDEγ photoprobe (at 0.8 μm) was incubated with 1 μm αt-GTPγS or 1 μm αt-GDP-AlF4− in Buffer B (20 mm HEPES, pH 7.5, 120 mm NaCl, 2 mm MgCl2) and then UV-photolyzed. The reactions with αt-GTPγS and αt-GDP-AlF4− were run side by side on the same gel, and intensities of the radiolabel transferred to the two conformers of αt were detected by autoradiography and compared after normalization with the protein amounts in the αt bands. αt-GDP-AlF4− was prepared by adding 10 mm NaF and 30 μm AlCl3 into holotransducin. βt thus served as an internal control. BSA was included in the reactions as another internal control. A, autoradiogram of label transfer from each PDEγ position to a pair of αt-GTPγS and αt-GDP-AlF4− (upper panel) and the corresponding αt bands on the Coomassie-stained gel (lower panel). Duplicates are shown for position 50. B, comparison of label transfer to the two αt conformers from the same PDEγ position. A labeling difference between the αt conformers from each PDEγ position is expressed as the percentage of the radiolabel on αt-GDP-AlF4− versus the label on αt-GTPγS minus 100%. Therefore, a positive value indicates more label on αt-GDP-AlF4− over αt-GTPγS, and a negative value is the reverse. Each bar is an average of 3–5 experiments (±S.D. (error bars)) except position 21 (one experiment). Student's t test indicates a very significant (**, p < 0.01) difference of percent labeling change (αt-GDP-AlF4− versus αt-GTPγS) between the PDEγ N-terminal region (positions 21, 30, 40, 50, and 60) and the C-terminal domain (positions 70, 73, 76 and 87). The photoprobe derivatization positions on PDEγ are listed under the figure.

