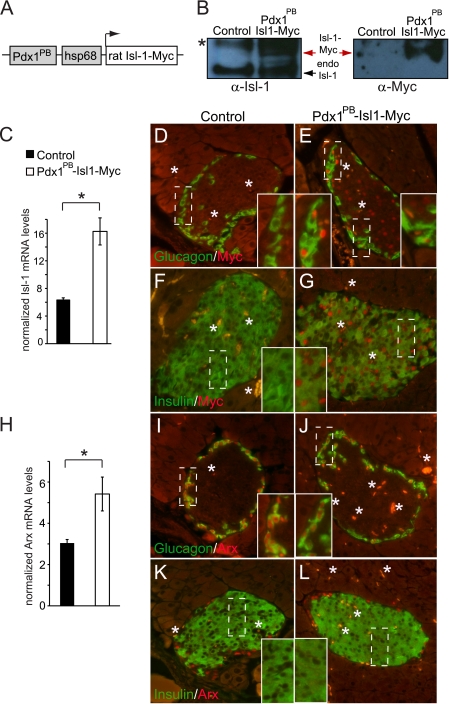
FIGURE 2.
Arx expression is elevated Pdx1PB-Isl-1-Myc mice. A, diagram representing the Pdx1PB-Isl-1-Myc transgenic construct, which contains the pdx1PB fragment of the pdx1 gene and the hsp68 minimal promoter. B, Western blot by α-Isl-1 and α-Myc analysis of total cell lysate from islets of 8-week-old control and Pdx1PB-Isl-1-Myc mice. The asterisk denotes a nonspecific band. C, Isl-1 mRNA levels in Pdx1PB-Isl-1-Myc and littermate control mice. Results are presented as mean ± S.E. *, p <0.05. D–G, immunohistochemical analysis for glucagon or insulin and Myc expression in 8-week-old Pdx1PB-Isl-1-Myc and control mice. H, Arx mRNA levels in Pdx1PB-Isl-1-Myc and control mice. Results are presented as mean ± S.E. *, p <0.05. I–L, costaining of Arx with glucagon or insulin in 8-week-old Pdx1PB-Isl-1-Myc and control mice. Insets show the magnified views of the outlined areas. The asterisk denotes autofluorescence from red blood cells.

