FIGURE 3.
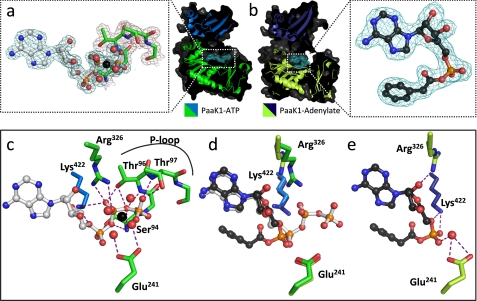
Comparison of conserved protein-substrate interactions pre- and post-adenylation reaction. a, secondary structure (green, N-terminal domain; marine blue, C-terminal domain) and surface (dark gray) of PaaK1 with ATP (teal electron density mesh) tightly bound within the active site. Inset, the well ordered P-loop of PaaK1 (green) envelopes the phosphates of the ATP (gray). Mg2+ coordinates the β- and γ-phosphates of ATP in addition to four water molecules. 2Fo − Fc electron density mesh is shown contoured to 1.0 σ. b, PaaK1 with phenylacetyl adenylate intermediate bound within the active site. (lime green, N-terminal domain; deep blue, C-terminal domain; dark gray, surface). Electron density mesh for the intermediate compound is shown (teal). Inset, the well ordered phenylacetyl-adenylate intermediate with 2Fo − Fc electron density mesh contoured to 1.0 σ. c, polar contacts (purple dashes) between conserved residues of PaaK1 (green) and ATP (gray). d, overlay comparison of conserved residues of PaaK1/ATP (green/marine blue) and PaaK1/adenylate (lime green/deep blue) structure. e, positions of conserved active site residues following the adenylation reaction with purple dashed lines representing polar interactions.

