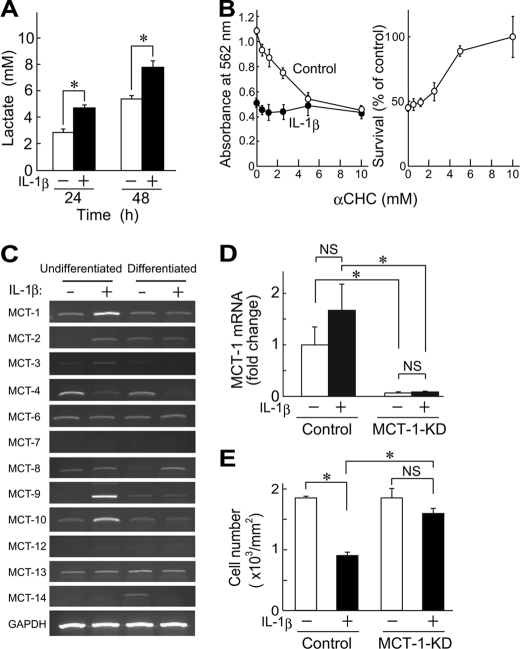
FIGURE 2.
Involvement of MCT-1 in IL-1β-induced cell death. A, ATDC5 cells were cultured for 24 or 48 h in the presence or absence of IL-1β (10 ng/ml), after which lactate concentrations in the culture supernatants were determined. Black and white columns show results obtained in cultures with and without IL-1β, respectively. B, ATDC5 cells were incubated with IL-1β (10 ng/ml) for 48 h in the presence of various concentrations of αCHC, an inhibitor of MCT. Cell viability was assessed using an MTT method. Left, absorbance of MTT-formazan formed in control (○) and IL-1β-treated cells (●). Right, results shown in the left panel are presented as the percentage of control cells cultured without IL-1β in the presence of αCHC. C, the expressions of mRNAs for Mct isoforms were assessed by RT-PCR. Total RNA was isolated from undifferentiated and differentiated ATDC5 cells after culturing for 48 h in the presence or absence of IL-1β (10 ng/ml). D, the expression of Mct-1 was suppressed by introducing its siRNA (MCT-1-KD). ATDC5 cells introduced with Mct-1 siRNA were incubated for 48 h with or without IL-1β (10 ng/ml). Signals from the target genes were normalized against that of GAPDH. The results are expressed as values relative to that obtained from the control cells (far left column). E, Mct-1-silenced cells (MCT-1-KD) and control cells (6 × 10⁴ cells/well) were incubated for 60 h with IL-1β (10 ng/ml). Cell viability was assessed by counting the number of adherent cells after toluidine blue staining. A, B, D, and E, results are shown as the mean ± S.D. (error bars) of four independent experiments. *, p < 0.05. NS, not significant.

