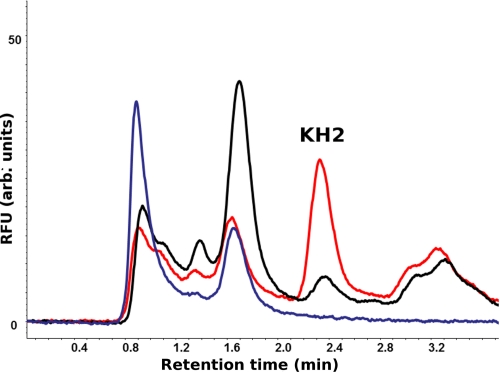
FIGURE 2.
VKORC1L1-mediated reduction of K1 quinone to K1 hydroquinone in HEK 293T whole cell membranes. C18 RP-HPLC chromatograms (overlaid) show the fluorescence peak of K1H2 at ∼2.4 min for wild-type HEK 293T cell membranes incubated with DTT in the absence of K1 substrate (blue trace) and with DTT and K1 (black trace) and for HEK 293T cells overexpressing VKORC1L1 incubated with DTT and K1 (red trace).

