FIGURE 4.
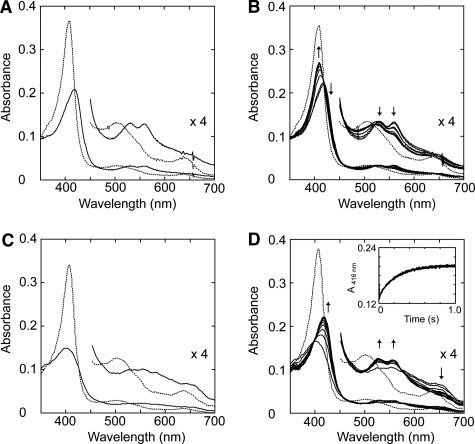
Spectral changes of T. cervina LiP* after H2O2 addition measured with diode array spectrophotometer (A and B) and stopped-flow rapid scan equipment (C and D). A, spectra of 2.5 μm LiP* in 20 mm sodium succinate buffer (pH 4.0) containing 1 mm CaCl2 (resting state, dashed line), and 2 s after the addition of 3.75 μm H2O2 (Compound II-like spectrum; solid line). B, spectral changes observed during 2–120 s after the addition of H2O2 indicating self-reduction to the enzyme resting state (spectra acquired at 2 s, and then each 20 s). C, spectra of 19.2 μm LiP* in 20 mm sodium succinate buffer (pH 4.0) containing 1 mm CaCl2 (resting state, dashed line) and after 10 ms from the addition of 192 μm H2O2 (typical Compound I spectrum, solid line). D, spectral changes observed during 1000 ms after the addition of H2O2 indicating rapid decay of Compound I to Compound II (spectra acquired at 10 ms, and then each 100 ms) (inset, 416-nm trace showing Compound I decay). Details (×4 absorbance) of the 450–700 nm region are shown.

