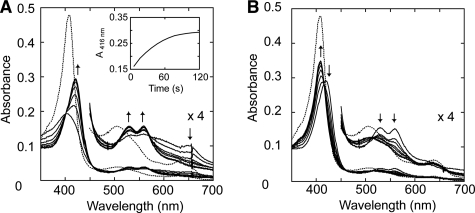
FIGURE 5.
Spectral changes of the Y181N variant after the addition of H2O2 measured with diode array spectrophotometer. A, spectrum of 3.3 μm Y181N in 20 mm sodium succinate buffer (pH 4.5) containing 1 mm CaCl2 (resting state, dashed line), and spectral changes of Y181N during the 2–120-s period after the addition of 4.9 μm H2O2 (solid lines), indicating Compound I self-reduction to Compound II (spectra acquired at 2 s, and then each 20 s) (inset, 416-nm trace showing Compound I decay). B, spectrum of resting Y181N (dashed line), and spectral changes of Y181N obtained during the 180–900-s period after H2O2 addition, indicating Compound II self-reduction to resting state (spectra acquired at 180 s, and then each 120 s). Details (×4 absorbance) of the 450–700 nm region are shown.

