FIGURE 3.
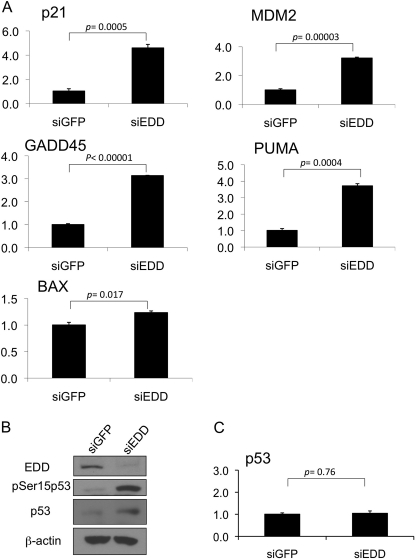
Silencing of EDD induces the expression of p53 target genes. A, WI38 cells were infected with Ad-siGFP or Ad-siEDD#5 at a multiplicity of infection of 600. Three days later, RNA was extracted, and quantitative real time PCR analysis was performed using primers specific for the selected p53 target genes or GAPDH as indicated. Results were normalized to GAPDH levels and are expressed relative to the expression of the genes in the siGFP control. The graphs represent means ± standard errors. The p values are based on a paired two-tailed t test. PUMA, p53 up-regulated modulator of apoptosis. B, an aliquot of cell lysates for panel A was analyzed by Western blotting with the indicated antibodies. C, quantitative real time PCR analysis was performed using primers specific for p53 in the same RNA extracted for panel A. Results were analyzed as described for panel A.

