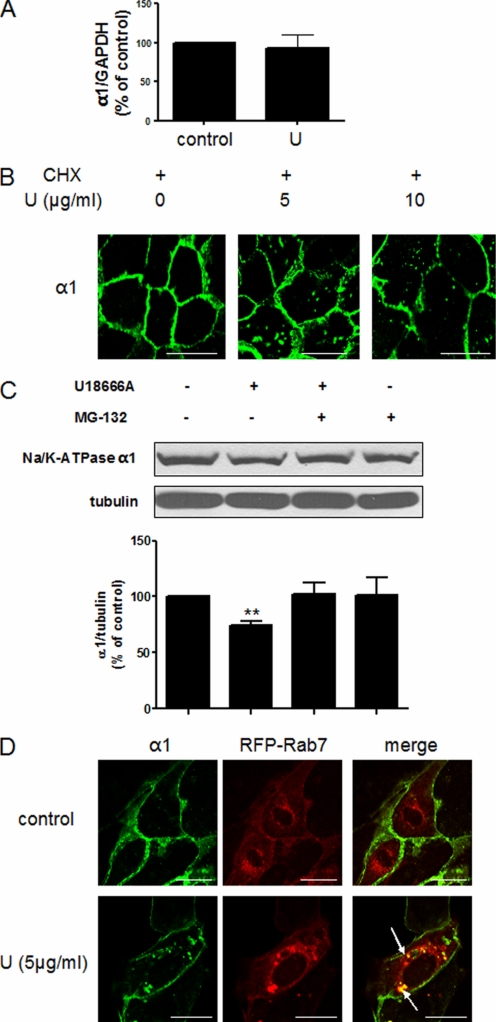
FIGURE 3.
Membrane cholesterol reduction leads to the endocytosis and degradation of α1 Na/K-ATPase. A, LLC-PK1 cells were treated with 10 μg/ml U18666A for 24 h. Total RNA was extracted, and quantitative RT-PCR was performed to probe α1 and GAPDH mRNA as described under “Experimental Procedures.” Data were from three independent experiments. U, U18666A. B, LLC-PK1 cells were treated with cycloheximide (10 μg/ml for 1 h) before being exposed to different doses of U18666A for 24 h. Cells were then fixed and immunostained for the Na/K-ATPase α1 subunit. Representative confocal images are shown. CHX, cycloheximide. U, U18666A. C, LLC-PK1 cells were treated with 10 μg/ml U18666A in the presence (+) or absence (-) of 20 μm MG-132 for 24 h. Representative Western blots are shown on the levels of the α1 subunit and α-tubulin. Quantitative data from four separate experiments are shown below and expressed as mean ± S.E. **, p < 0.01 compared with control. D, LLC-PK1 cells were transfected with RFP-Rab7 for 24 h before exposed to 5 μg/ml U18666A for 24 h. Afterward, cells were fixed and immunostained for the α1 subunit. Representative confocal images of α1 staining, RFP-Rab7, and merged figures are shown. The arrows point to the colocalization of α1 and RFP-Rab7. The same experiments were repeated at least three times. Scale bar = 20 μm.

