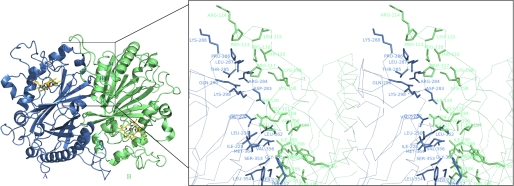
FIGURE 3.
Structure of the homodimer and stereoview of the dimer interface. The homodimer is shown in schematic representation; molecule A is in blue and molecule B is in green. Two heme molecules are shown in stick representation. The zoomed region shows the secondary structures contributing to the dimer formation. The residues that form the interface are shown in sticks with molecule A in blue and molecule B in green.

