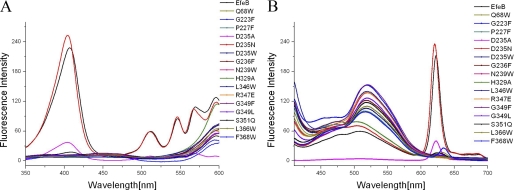
FIGURE 5.
PPIX production of EfeB mutants tested by fluorescence scan of cell lysates of bacteria overexpressing mutants. Native EfeB was used as a positive control. A, excitation wavelength scan for mutants and native EfeB. The obvious excitation wavelength at 407.5 nm was detected for EfeB. No distinctive excitation wavelength was observed for these mutants except for D235N,D235A and S351Q, which kept about 102, 17, and 8% fluorescence intensity of native EfeB, respectively. B, emission wavelength scan for mutants and native EfeB. The distinct emission wavelength at 622.5 nm was observed for EfeB, no emission wavelength was detected for these mutants except for D235N,D235A and S351Q, which kept about 102, 17, and 8% fluorescence intensity of native EfeB, respectively.

