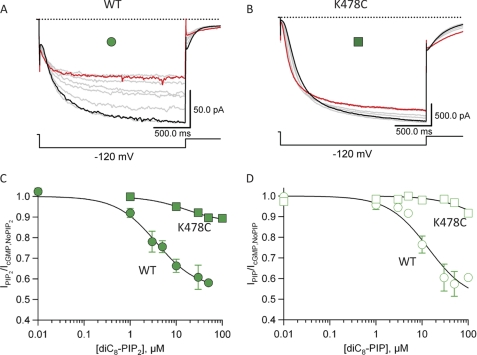
FIGURE 8.
Dose-response relationship of PIP2 and PIP in SpIH and K478C mutant channels. A, representative SpIH currents measured during a −120-mV test pulse in the presence of 1 mm cGMP (black trace) and increasing concentrations of diC8-PIP2 (100 μm = red trace). B, representative K478C currents measured during a −120-mV test pulse in the presence of 1 mm cGMP (black trace) and increasing concentrations of diC8-PIP2 (100 μm = red trace). C and D, data from three patches were averaged and plotted as a function of PIP2 or PIP concentration, respectively. Data were fit with the Hill equation (see “Experimental Procedures”). For SpIH, IPIP2/IcGMP,No PIP2 = 55%, K1/2,PIP2 = 3.6 μm, IPIP/IcGMP,No PIP = 49%, and K1/2,PIP = 13.6 μm.

