FIGURE 6.
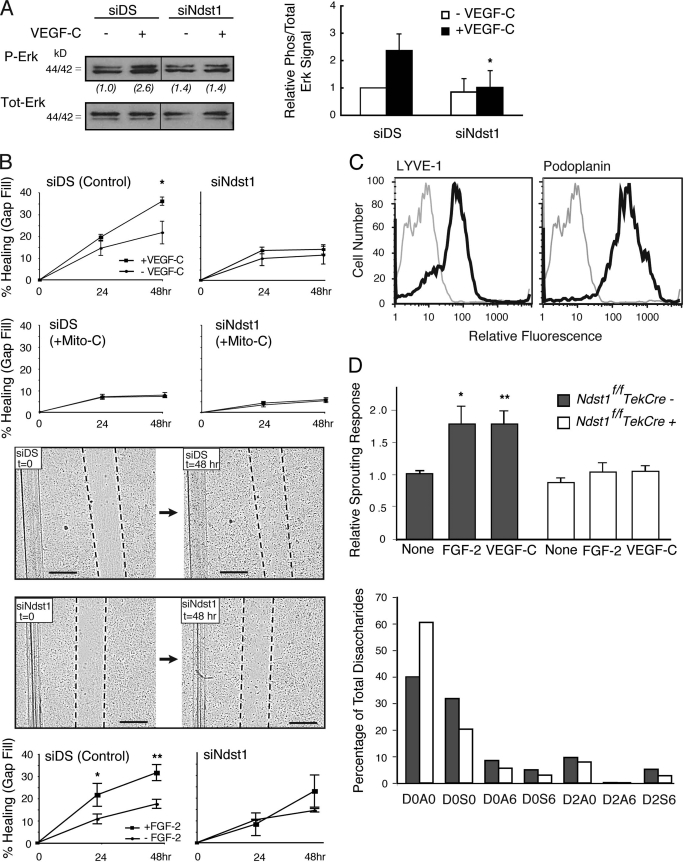
Targeting lymphatic endothelial Ndst1 results in reduced growth and sprouting responses to VEGF-C and FGF-2. A, serum-starved human lymphatic endothelia were transfected with siRNA targeting Ndst1 (siNdst1) or with scrambled duplex RNA (siDS; control). Phosphorylation of Erk1/2 before/after VEGF-C exposure was examined by Western blotting. Total Erk for each condition is shown. Ratios of phospho/total Erk band intensities for each condition were quantified and normalized to the respective base-line ratio (values in parentheses). Graph (right) shows mean signal intensities for n = 4 experiments (±S.E.). B, ability of the siRNA-targeted lymphatic endothelia to fill a gap made between cells in a scratch assay was examined over 48 h in the presence/absence of growth factor. Photomicrographs show gap (with dotted gap boundaries) within confluent cell layers at time 0, and at 48 h in the presence of VEGF-C (bar, 0.5 mm). Control siDS cells partially filled the gap over 48 h (upper photomicrographs), whereas response by siNdst1-targeted cells is shown below. Mean values for responses in the presence/absence of VEGF-C were graphed (top). *, p = 0.01 for VEGF-C versus un-stimulated cells at 48 h. Graphs for assays carried out in the presence of the cell proliferation inhibitor mitomycin-C are also shown (labeled +Mito-C). The scratch assay was also carried out for cell stimulation in the presence/absence of FGF-2 (graphs shown below photomicrographs). *, p = 0.008 for FGF-2 versus unstimulated cells at 24 h; **, p < 0.001 for FGF-2 versus unstimulated cells at 48 h. (Graphs, mean of n = 3 trials.) C, lymphatic endothelia were isolated from oil granuloma/lymphangioma lesions generated in Ndst1f/fTekCre(+) mutant mice and Cre(−) littermates, with podoplanin and LYVE-1 expression shown by FACS. D, sprouting responses in collagen upon stimulation with recombinant VEGF-C or FGF-2 were examined. Significant responses to growth factor were noted for Cre(−) wild type cells (*, p = 0.003, and **, p = 0.008 for respective VEGF-C and FGF-2 responses versus base-line responses in the absence of growth factor, None). Mutant responses (right) were not significantly different from base line. Sulfation of heparan sulfate disaccharides purified from mutant versus wild type cells was determined by liquid chromatography/mass spectrometry and quantified as a percentage of total disaccharides (bottom graph). The detected disaccharide species are listed (x axis) according to published nomenclature (21), with D0A0 (left-most bars) indicating the percentages of unsulfated disaccharides.

