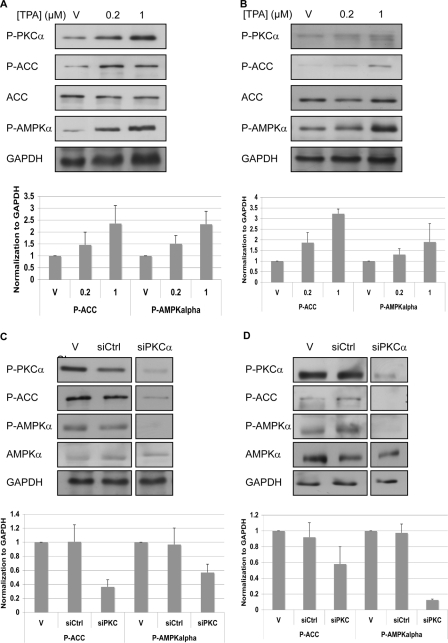
FIGURE 3.
c-Src regulates AMPK through PKC. A and B, cells were treated with TPA to activate PKC. After 1 h cells were lysed and analyzed by Western blotting. C and D, cells were transfected with siRNA against PKCα. After 96 h cells were lysed and analyzed by Western blotting. The strips were from a single blot. The figure shows where the scans were cut for presentation purposes. A and C, A431 cells. B and D, OVCAR3 cells. Representative Western blot analysis using the indicated antibodies is shown. GAPDH served as a gel loading control. P-AMPKα and P-ACC levels were normalized to GAPDH levels (bottom). The graphs show the calculated averages ± S.D. from four independent experiments (A–D). V, vehicle; siCtrl, nontargeting siRNA; siPKCα, siRNA against PKCα.

