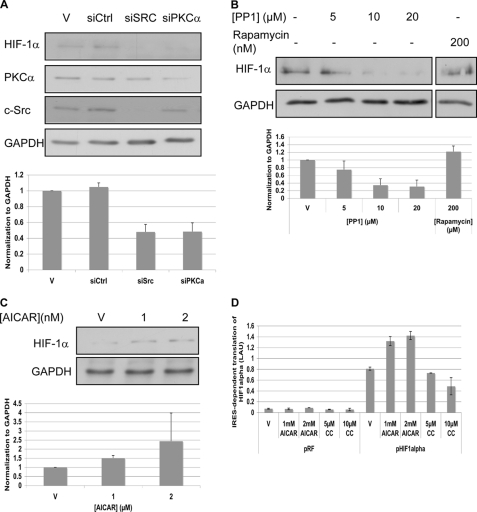
FIGURE 6.
IRES- versus cap-dependent translation. A, OVCAR3 cells were transfected with siRNA against c-Src or PKCα. After 96 h cells were lysed and analyzed by Western blotting. B, OVCAR3 cells were starved for serum and after 2 h were treated with PP1 or rapamycin. After 4 h cells were lysed and analyzed by Western blotting. The strips were from a single blot. The figure shows where the scans were cut for presentation purposes. A and B, Hif-1α levels were normalized to GAPDH levels (bottom). The graphs show the calculated averages ± S.D. from two independent experiments, whereas the blots show one representative experiment. C, OVCAR3 cells were starved for serum and after 2 h were treated with AICAR. After 4 h cells were lysed and analyzed by Western blotting. Hif-1α levels were normalized to GAPDH levels (bottom). A representative blot is shown. The graphs show the calculated averages ± S.D. from three independent experiments. D, OVCAR3 cells were transfected with the HIF-1α bicistronic construct. Activation of AMPK by AICAR or its inhibition by compound C had an effect on the FFL/SPL ratio. Error bars represent the S.D. of duplicate samples. V, vehicle. The experiment was performed two times.

