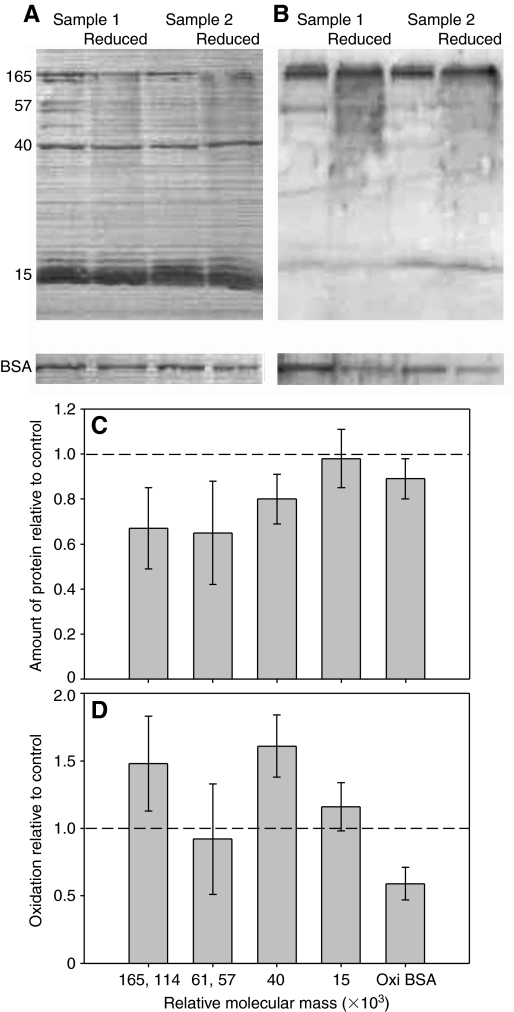
Fig. 3.
The effect of sodium borohydride on the proteins in A. subfuscus glue. (A) Coomassie-Blue-stained blot showing the proteins present in the glue, and (B) anti-DNPH immunostained duplicate blot. Two different samples are shown; for each, the left lane is untreated whereas the right lane was reduced with borohydride. Oxidized BSA controls treated in the same way are shown at the bottom. The numbers on the left show relative molecular mass (×103). (C) Amount of soluble protein in borohydride-treated samples relative to untreated controls for selected proteins. (D) Extent of oxidation of selected proteins from borohydride-treated samples relative to their untreated counterpart. Some proteins were grouped together because they were difficult to quantify separately. The dashed lines in C and D correspond to the y-value if there was no difference between the control and treatment. Values are means ± s.e.m. (N=5).

