
Figure 8.
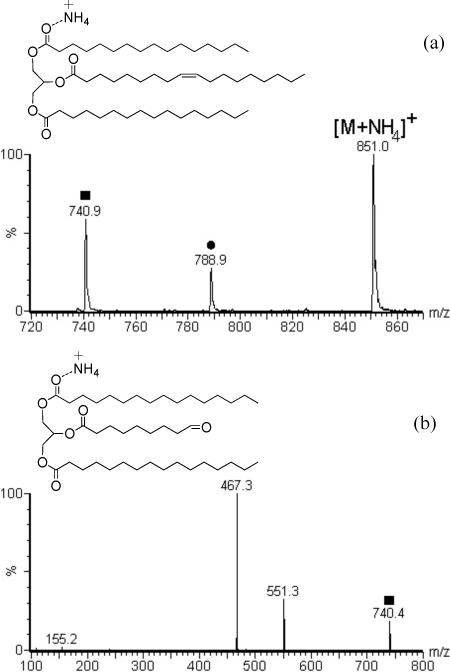
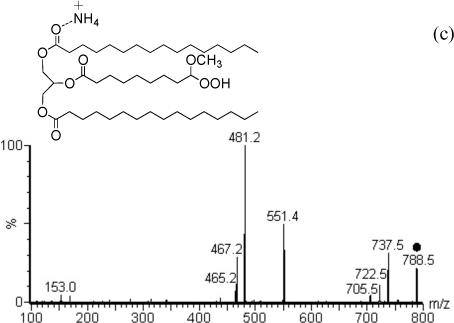
(a) The OzESI-MS spectrum of 1 μM methanolic solution of TG(16:0/9Z-18:1/16:0) with 5 mM ammonium acetate recorded as a m/z 551 precursor ion scan and thus showing only the [M+NH4]+ molecular ion and corresponding chemically induced fragment ions. (b) The MS/MS spectrum of the OzESI-MS product ion at m/z 740 (C.E. = 20 eV). (c) The MS/MS spectrum of the OzESI-MS product ion at m/z 788 (C.E. = 20 eV). The symbols • and ■ identify the ozonolysis product ions as α-methoxyhydroperoxides and aldehydes, respectively.