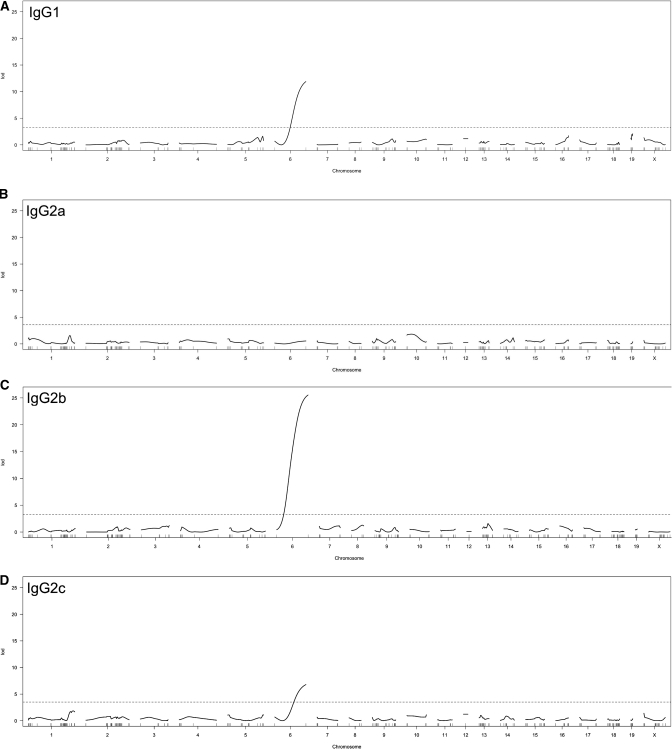
Figure 3.
Major IgG subclass quantitative trait locus peaks are detected for IgG1, IgG2b and IgG2c each center on the rat IgH locus on chromosome 6 (P<0.00001 for each). The genome-wide LOD scores for IgG subclass levels in the F2 progeny of an SHR-A3 x SHR-B2 cross are plotted. Broken lines indicate LOD threshold (P<0.05) determined by permutation. No LOD peaks achieved statistical significance for IgG2a.

