Figure 1.
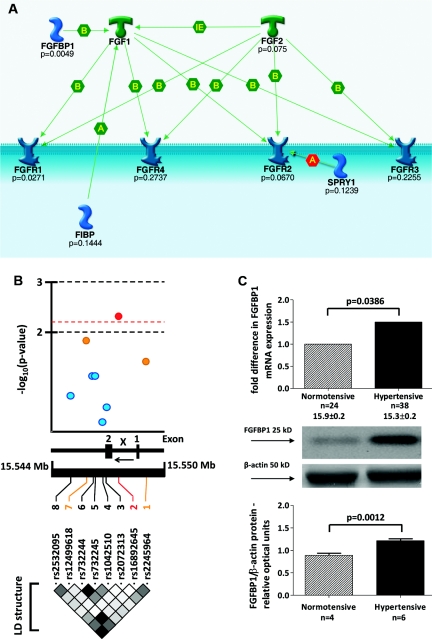
FGFBP1 is associated with hypertension: family-based association analysis and gene expression studies. (A) The results of the primary family-based association analysis (the most significant P values) in SHS are shown at the background of molecular interactions within the pathway (image created using the GeneGo software). FGF1, fibroblast growth factor 1; FGF2, fibroblast growth factor 2; FGFBP1, fibroblast growth factor binding protein 1; FGFR1, fibroblast growth factor receptor 1; FGFR2, fibroblast growth factor receptor 2; FGFR3, fibroblast growth factor receptor 3; FGFR4, fibroblast growth factor receptor 4; FIBP, fibroblast growth factor (acidic) intracellular binding protein; SPRY1, sprouty homolog 1, antagonist of FGF signaling; B, binding; A, allosteric effect; IE, influence on expression. (B) FGFBP1 and hypertension: fine mapping analysis in SHS. (Top) −Log-transformed probability values from the family-based association analysis. (Middle) Structure of FGFBP1 gene: 1, first untranslated exon; 2, coding exon; x, intron 1; ←, direction of transcription. (Bottom) LD map (r2 coefficients–based) of FGFBP1 (black corresponds to r2 = 0.8 to 1 − maximal LD, and white corresponds to r2 = 0 to 0.2 − no or weak LD) in SHS. (C) Comparative analysis of FGFBP1 mRNA and protein expression in hypertensive and normotensive kidneys from SRTB. n, number of subjects.

