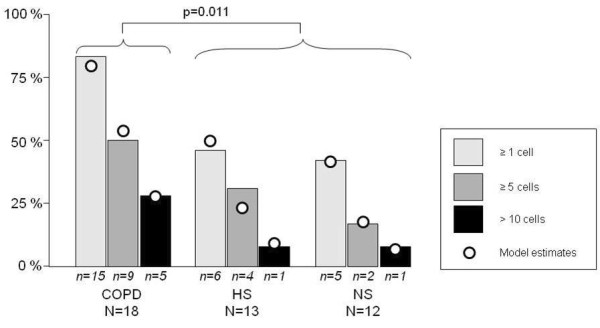
Figure 4.

Number and proportions of subjects with cells staining positive for α-SMA. Data is given for the three groups COPD, smoking controls (S) and non-smoking controls (NS). The numbers (n) of individuals in each category is presented as digits underneath each bar. The odds for a COPD patient to be in a higher category is statistically increased (P < 0.05) compared to subjects in the control groups.
