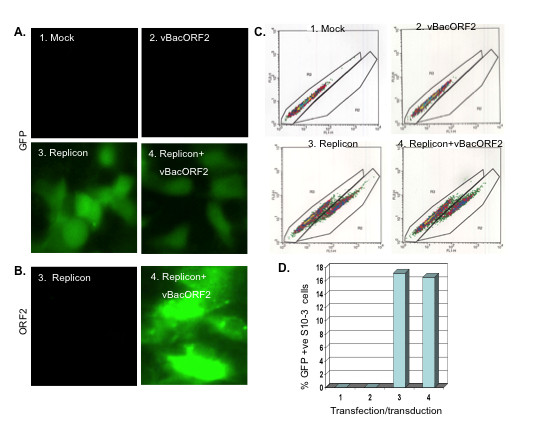
Figure 4.

Co-expression of ORF2 and GFP proteins in HEV replicon-transfected cells in a culture. (A) FM, showing GFP expression in cells at day 6 post-transfection. (B) IFM, showing ORF2 expression in cells at day 5 post-transduction. (C) FACS plot, showing expression of GFP in cells at day 6. (D) %GFP positive cells in C, determined by FACS.
