
Figure 1.
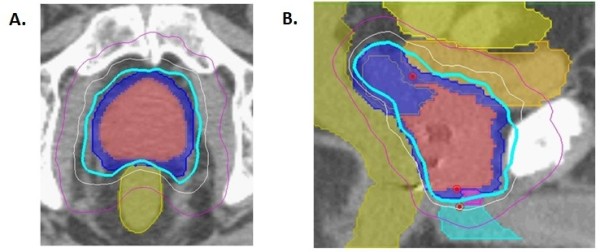
Treatment planning axial (A) and sagittal (B) computed tomography images demonstrating the GTV (red), CTV and PTV expansion (dark blue), bladder (orange), rectum (green), bowel (yellow), membranous urethra (pink) and penile bulb (light blue). Isodose lines shown as follows: Blue 79% (prescription), white 70% and purple 50%.