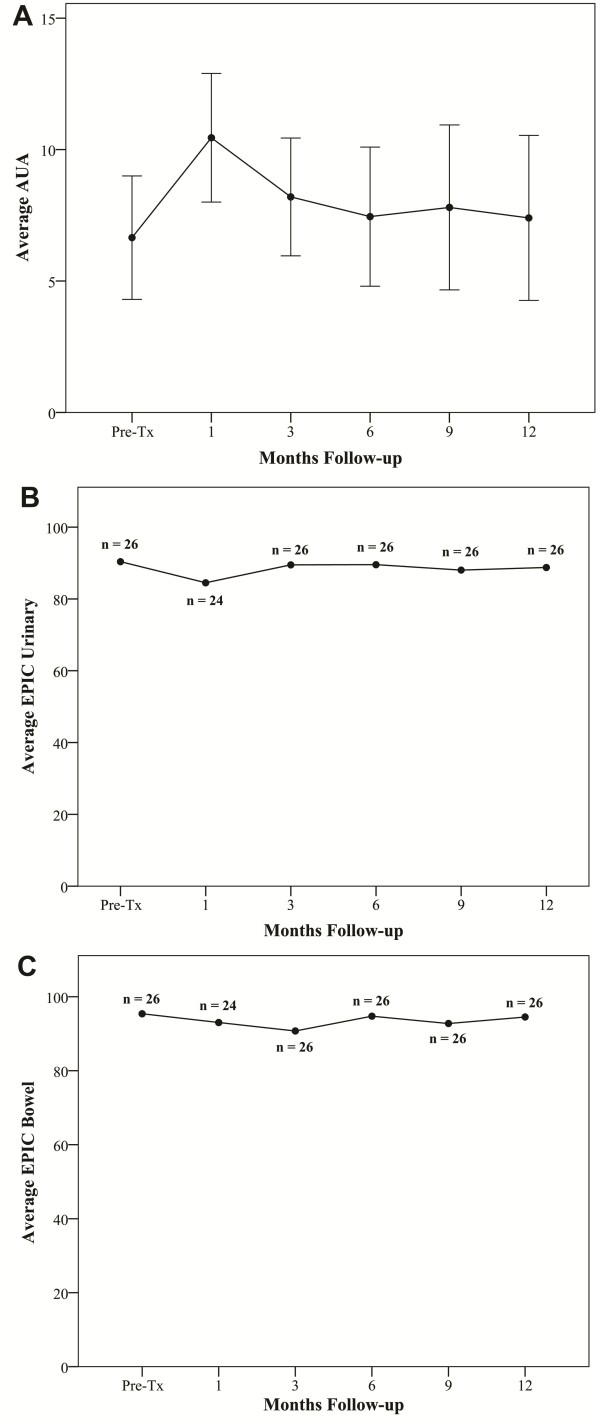
Figure 5.
Urinary and bowel quality of life using the American Urology Association (AUA) score and the Expanded Prostate Cancer Index Composite (EPIC): (A) AUA score, (B) EPIC urinary and (C) EPIC bowel. The graphs show unadjusted changes in average scores over time for each domain. AUA scores range from 0 - 35 with higher values representing worsening urinary symptoms. EPIC scores range from 0 - 100 with higher values representing a more favorable health-related QOL. Numbers above each time point indicate the number of observations contributing to the average. Error bars indicate 95% confidence intervals.

