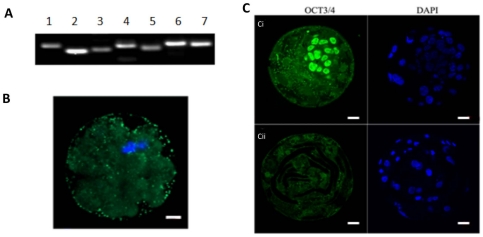
Figure 2. Chromosomal DNA and cytoplasmic regulation of iSCNT embryos.
(A) Analysis of microsatellite markers in a single iSCNT morula after whole genome amplification. Lane 1, D8Mit242; Lane2, D19Mit10; Lane 3, D16Mit146; Lane 4, D1Mit206; Lane 5, DXMit170; Lane 6, D12Mit270; Lane 7, D4Mit178. (B) DAPI (blue) and NPC (green) staining in a murine-porcine cloned embryo undergoing cytokinesis. (C) Distribution of OCT-4 in a murine in vivo blastocyst (i); and a murine-porcine cloned blastocyst (ii). OCT-4 and DAPI are shown in green and blue, respectively. Scale bars = 20 µm.

