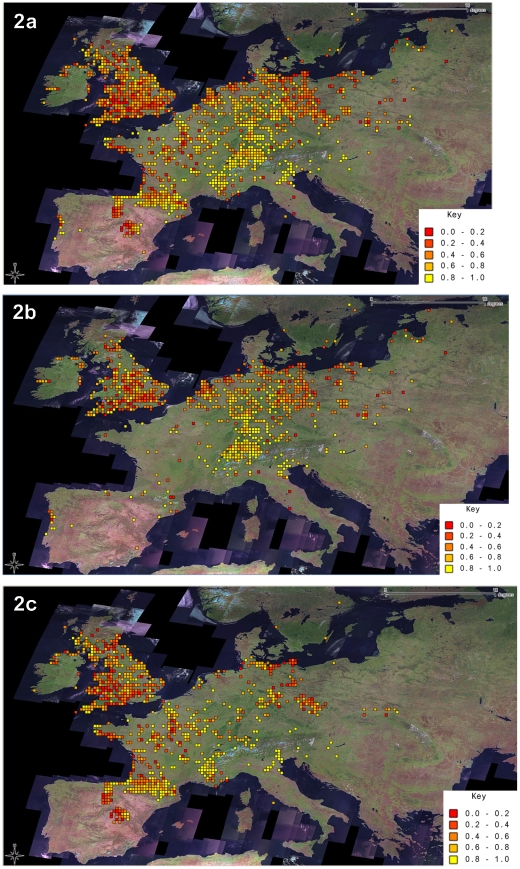
Figure 2. Frequency of Yellow C. nemoralis recorded as population averages in quarter degree cells of latitude and longitude.
(a) the modern and historic datasets combined (b) the modern dataset and (c) the historical dataset. The Key shows the division of the frequency of the Yellow morph by intervals of 0.2.

