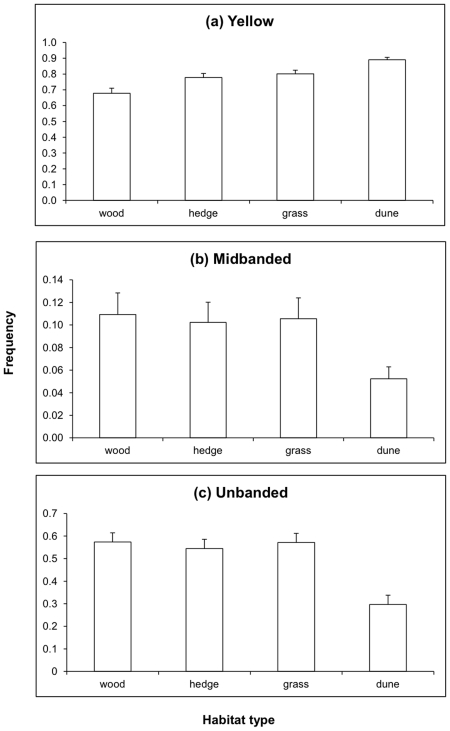
Figure 3. Frequency of morphs in four habitat types, as predicted from the models in Table 2 .
Standard errors are shown. (a) Yellow, all differences between habitats are significant P<0.001; (b) Mid-banded, differences between dune habitat and all others are significant P<0.001. Other differences are not significant; (c) Unbanded. All differences are significant except for that between grassland and woodland. (P<0.001 for all comparisons involving dune, P = 0.023 for woodland v hedge, P = 0.027 for hedge v grassland). All P values in these comparisons were corrected for multiple testing using Bonferroni.

