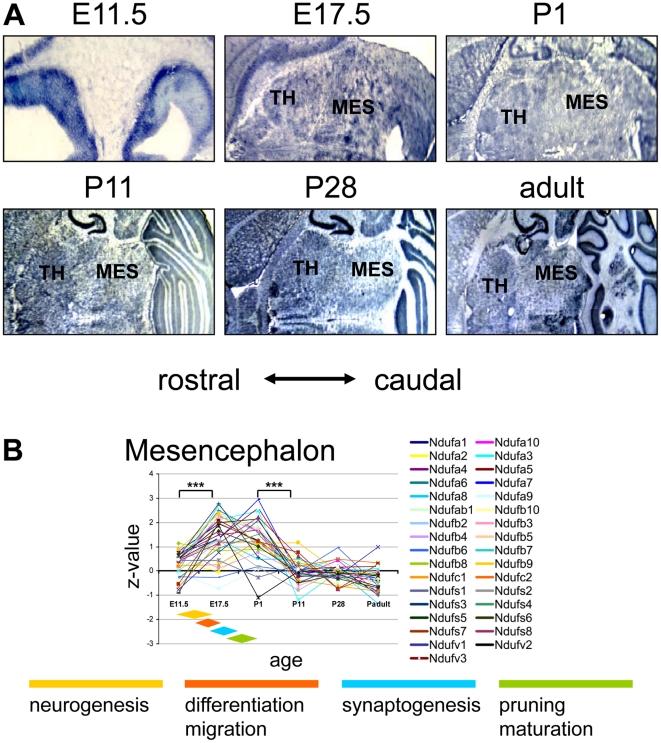
Figure 6. Complex I expression in the murine mesencephalon.
(A) ISH image for the complex I subunit Ndufb2 probe in the mesencephlaon during pre- and postnatal development. The images were recorded at x10 (E11.5) and at x2.5 magnification thereafter. At E11.5 the expression is shown in the precursor structures of mesencephalon pons and thalamus. (B) Z-transformed expression intensities for each probe plotted against the developmental age in two sections of the cerebral cortex. The diamond shaped color fields illustrate the region specific stages of neuronal development. Significance levels of differences in expression are depicted by stars: *** p<0.0001; ** p<0.001; CGI, Cortex-granular insular; CTA, Cortex-temporal anterior. MES, mesencephalon; TH, thalamus.

