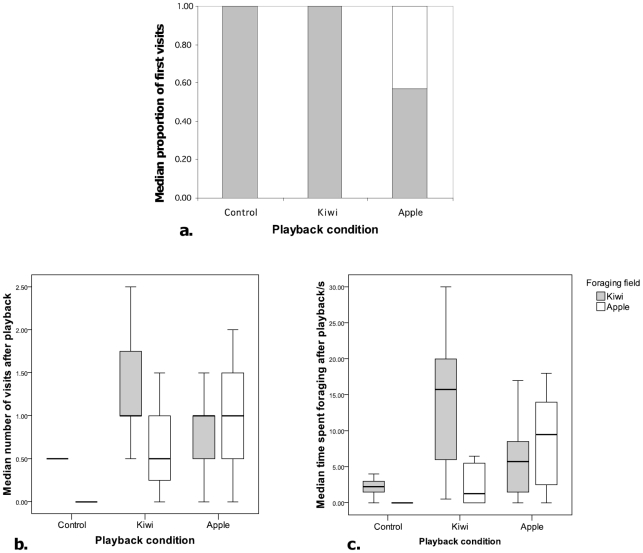
Figure 2. Box plots indicating foraging responses of bonobos (N = 4) following playbacks of food-associated calls given to high value (kiwi) or low value (apple) foods.
(a) Site of first entry expressed as a median proportion of the individual's median choices per condition; (b) median number of visits per trial; (c) median time spent foraging following playback (s). Box plots illustrate medians, inter-quartile ranges, and highest and lowest values, excluding outliers.

