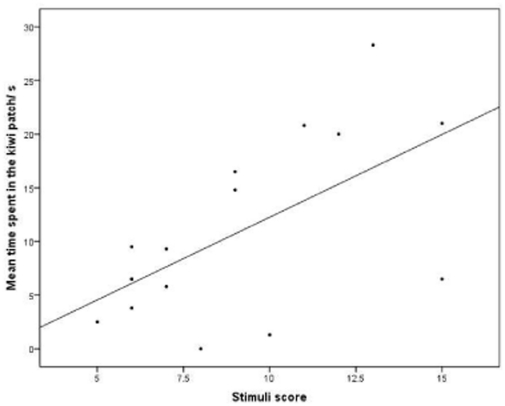
Figure 3. Scatter plot showing the relationship between the food type encountered (highly preferred = kiwi, less preferred = apple) and the cumulative value of the stimuli sequence.
Calls were assigned a cardinal score based on how frequently they were produced in response to high vs. low value food (e.g. barks were six times more frequent to high than low preference foods, so that: B = 6.00, P = 1.86, PY = 0.52, Y = 0.12). The relationship between foraging responses and stimuli scores are indicated in table 3.

