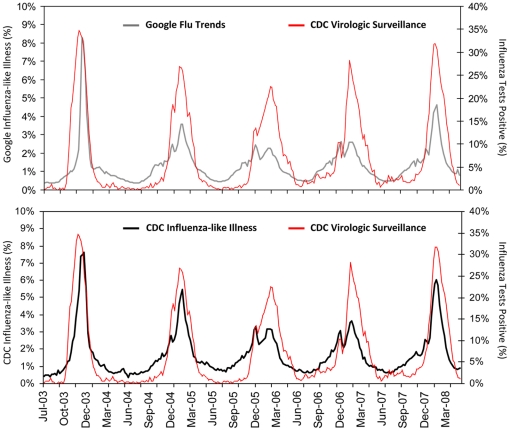
Figure 1. United States Influenza Surveillance by Google Flu Trends1, CDC Influenza-like Illness Surveillance2, and CDC Influenza Virologic Surveillance3, June 29, 2003 through May 31, 20084.
1Google Flu Trends estimates the percentage of persons seeking health care for the non-specific complaint of influenza-like illness (ILI) based on internet key word searches. 2CDC Influenza-like Illness Surveillance involves a network of health care providers who record the weekly proportion of patients seen with ILI. Google Flu Trends was created and validated using CDC ILI Surveillance data, explaining the similarity between the two curves. 3CDC Influenza Virologic Surveillance consists of about 140 laboratories located throughout the United States that report the weekly total specimens tested and laboratory tests positive for influenza virus. This is the only US surveillance system that provides national and regional data of laboratory-confirmed influenza virus infection. 4Because CDC surveillance is intensified from calendar week 40 through calendar week 20 of the subsequent year, we restricted our correlation analyses to this time period.

