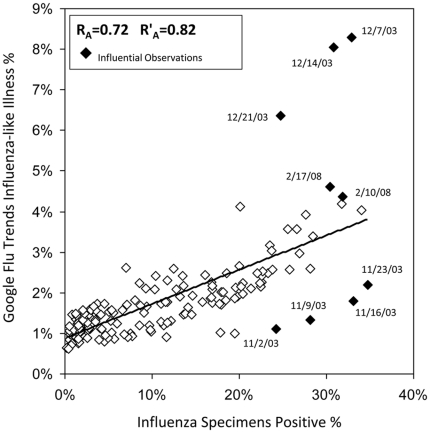
Figure 2. Scatter Plot Google Flu Trends and CDC Influenza Laboratory Surveillance; September 28, 2003 through May 17, 2008.
1. Data Sources: a. US Influenza Virologic Surveillance System (http://www.cdc.gov/flu/weekly/fluactivity.htm); and b. Google Flu Trends (http://www.google.org/about/flutrends/us-historic.txt). 2. There are 166 total observations in each panel. Influential observations were defined by DFBETA statistic greater than the absolute value of 2 divided by the square root of the total number of observations in a simple linear regression model [17]. 3. RA represents Pearson's correlation coefficients calculated from comparisons of Google Flu Trends with US Influenza Virologic Surveillance. 4. R'A represents the calculated Pearson's correlation coefficients after exclusion of all influential observations. 5. Because CDC surveillance is intensified from calendar week 40 through calendar week 20 of the subsequent year, we restricted our correlation analyses to this time period.

