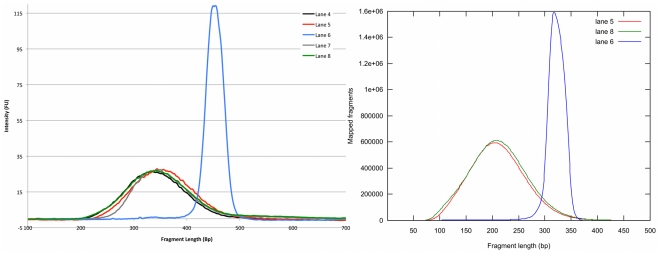
Figure 4. Size distribution of libraries.
a. Bioanalyzer traces of generated libraries. Lane 4, 5, 7 and 8 correspond to libraries generated using the automatic size selection protocol. Lane 6 (blue) has been prepared using ordinary agarose gel selection. b. Insert size distributions of human cancer cell line libraries (lane 5, 6 and 8) acquired after mapping the reads to the human genome.

