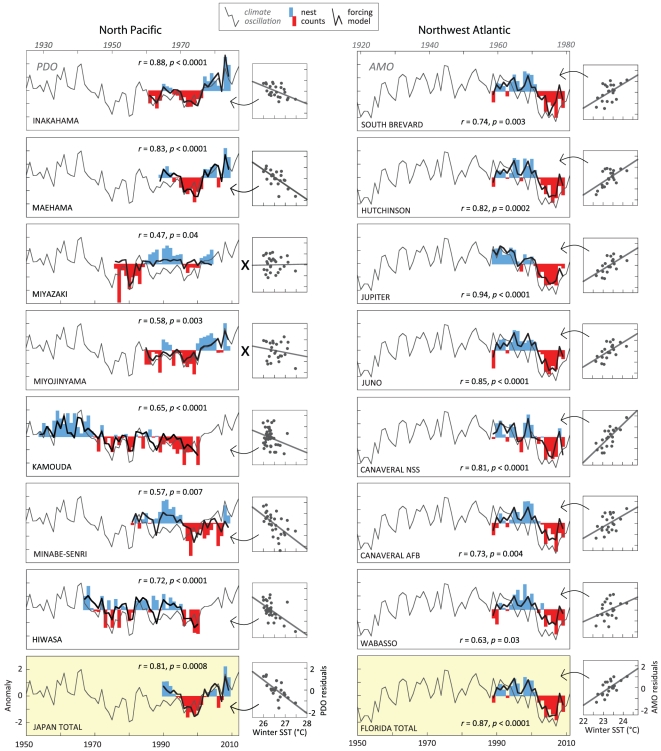
Figure 2. Climate forcing of loggerhead nesting.
Nest surveys are positive (blue) and negative (red) annual anomalies plotted against the survey year on the bottom x axis. The upper x axis is the year of the decadal oscillation (grey line) represented by the PDO and the AMO lagged 25 and 31 years, respectively. Highest-ranked climate forcing model (black line) incorporates the decadal series including (←) or without (x) the winter SST series. Scatter plots display relationships of the winter SST to residuals from the decadal series models alone. Regional total series (yellow panel) accumulates nests from all locations; Japan total provided by the Sea Turtle Association of Japan, Florida total accumulates nests from 15 index nesting beach surveys. Model correlation coefficients and p-values are provided.

