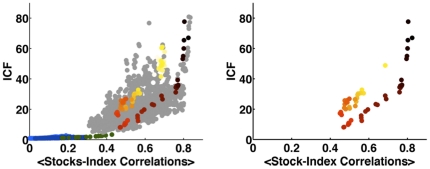
Figure 2. Time evolvement of the S&P500 market index cohesive force (ICF – the ratio between the raw correlations and the bare (partial) correlations), as function of the stocks-index correlations, during the last decade.
The color code on the left is as in Figure 1A in the text. On the right, we only present the time progression during 2010, colored from light yellow at the beginning of the year to black at the end of April. Using this color code, we observe that during early 2010 the market dynamics moved back towards the stable state, but this trend was reversed at the end of March and currently the market instability seems to rapidly evolve towards a more fragile state.

