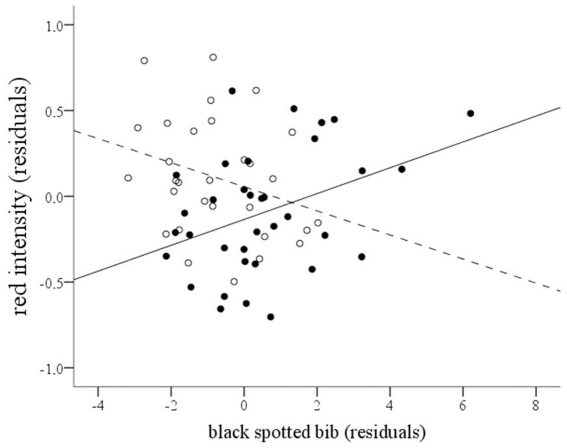
Figure 4. Relationship between red intensity and size of the black spotted bib.
Partridges exposed to diquat (full dots and continuous line) and control birds (empty dots and spotted line). Red intensity values are residuals after controlling for red chip variability and random factors. Bib data are residuals after controlling for the effect of α-MSH-treatment and random factors (all P's<0.05). The lines were calculated from the model (see slopes in Results).

