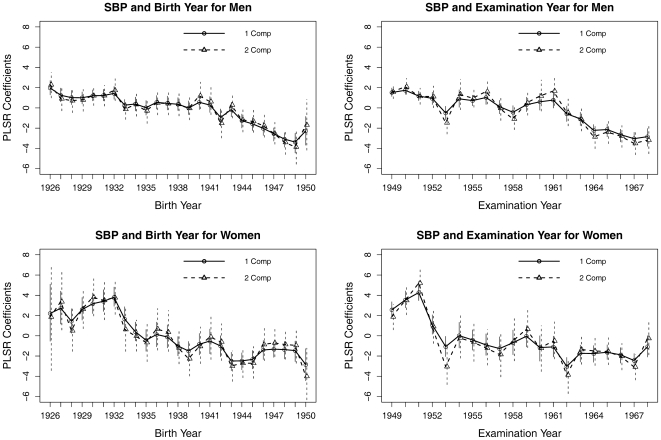
Figure 2. The partial least squares regression coefficients plots for the year of birth or the year at examination.
Both variables and age at examination are treated as categorical with the first year as the reference group. The vertical bars are the confidence intervals. The outcome variable is systolic blood pressure (SBP). PRESS only selected one PLS component for each model. The two-component models explained almost all the variances (>98%) in blood pressure than can be explained.

