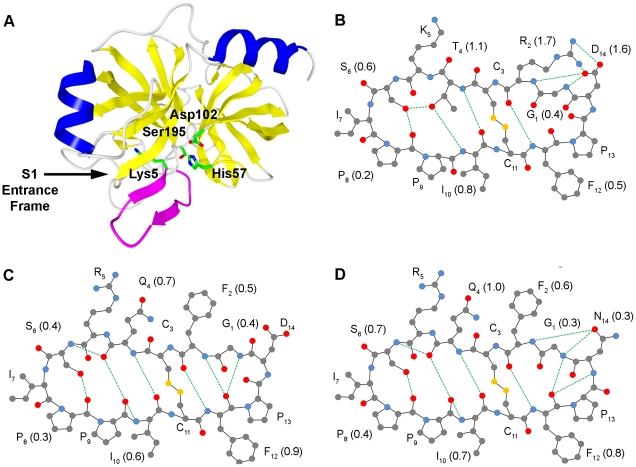
Figure 1. Representation of a trypsin/SFTI-1 complex and internal hydrogen bonding within SFTI variants during MD.
Ribbon plot of SFTI-1 in complex with trypsin (A) with β-sheets and α-helices coloured in yellow and blue respectively, excluding SFTI-1 which is displayed in magenta. The residues of the catalytic triad of trypsin and the P1 Lys of SFTI-1 are shown in stick models with carbon in green, nitrogen in blue and oxygen in red. The structure of SFTI variants are shown in ball and stick 2D model with intramolecular hydrogen bond networks for (B) SFTI-1, (C) SFTI-FCQR Asp14 and (D) SFTI-FCQR Asn14. Amino acids are labelled with one letter code and residue number in subscript while the frequency of hydrogen bonds per residue is in brackets (rounded to nearest tenth). Carbons, oxygen, nitrogen and sulphur are represented by gray, red, blue and yellow respectively while hydrogens are excluded for clarity. Bond lengths and angles are intentionally unrealistic to enable easy viewing of hydrogen bonds, represented by dotted green line. Only hydrogen bonds occurring in more than 50% of trajectory frames are shown. Data is represented as mean from three independent 5 ns MD trajectories.

