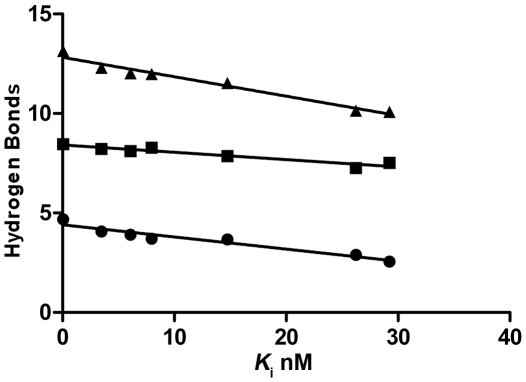
Figure 3. Relationship between K i and number of internal hydrogen bonds.
Plot of the average number of internal (circles), intermolecular (squares) and total (triangles) hydrogen bonds of SFTI-FCQR variants (Asn14, Tyr14, Lys14, Asp14, Gly14, Ala14 and Ser14) from Table 1 versus Morrison K i values from Table 2.

