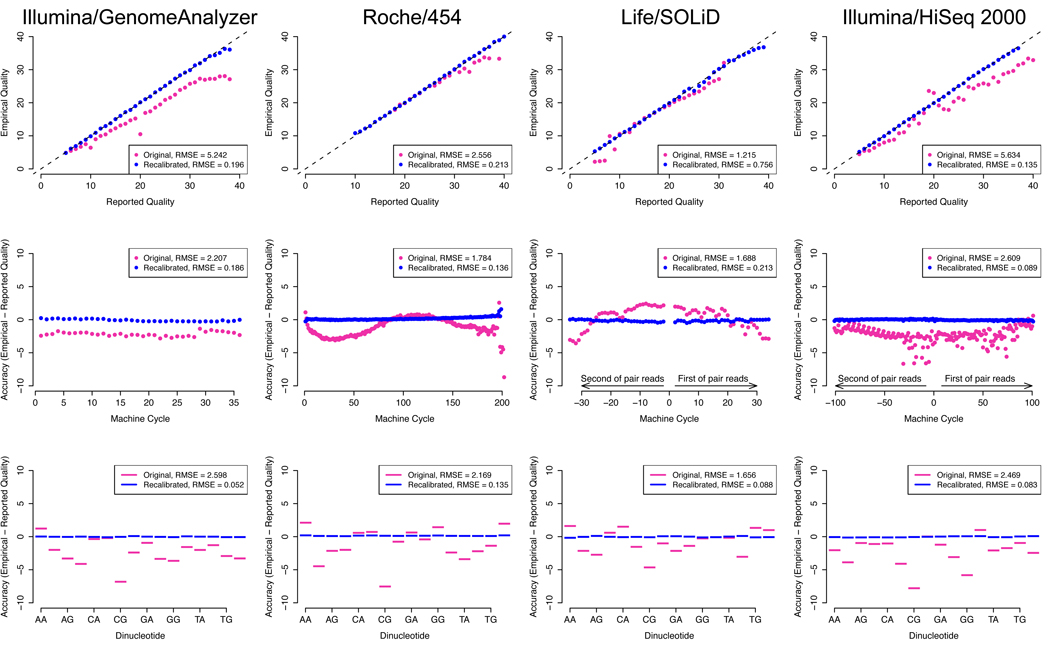
Figure 3.
Raw (violet) and recalibrated (blue) base quality scores for NGS paired end read sets of NA12878 of (a) Illumina/GA (b) Life/SOLiD and (c) Roche/454 lanes from 1000 Genomes, and (d) Illumina/HiSeq. For each technology: top panel: shows reported base quality scores compared to the empirical estimates (Methods); middle panel: the difference between the average reported and empirical quality score for each machine cycle, with positive and negative cycle values given for the first and second read in the pair, respectively; bottom panel: the difference between reported and empirical quality scores for each of the 16 genomic dinucleotide contexts. For example, the AG context occurs at all sites in a read where G is the current nucleotide and A is the preceding one in the read. Root-mean-square errors (RMSE) are given for the pre- and post-recalibration curves.

