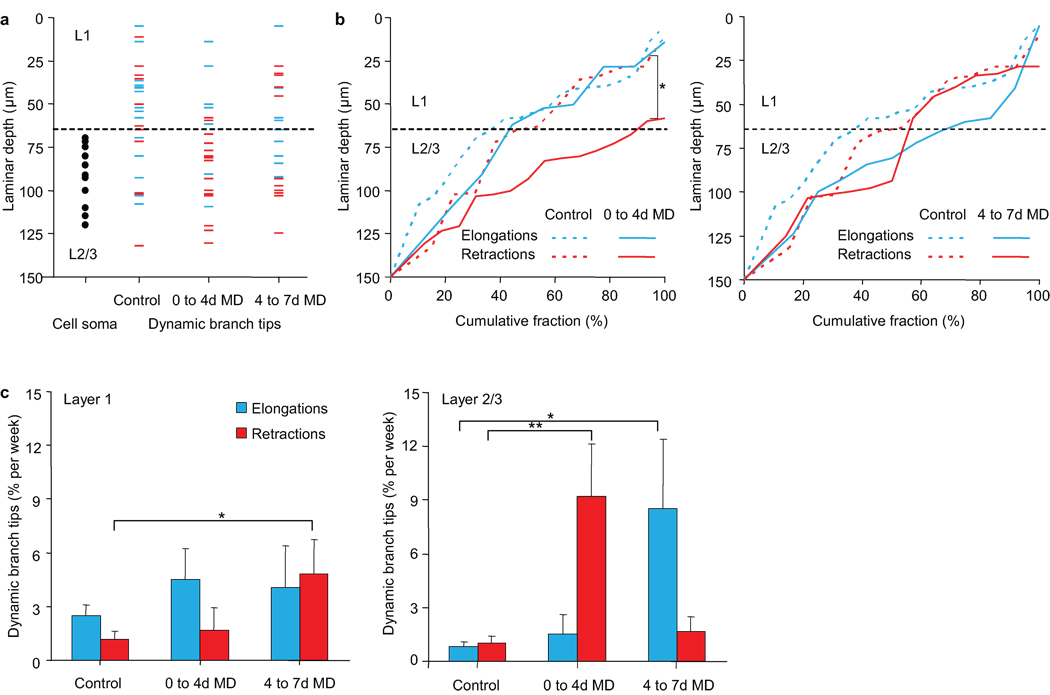
Figure 4.
Monocular deprivation induces laminar specific dendritic arbor rearrangements. (a) Distribution of dynamic branch tips before and during monocular deprivation in binocular visual cortex. Plotted are cell soma positions (black circles) and branch tips positions of branch tip elongations (blue) or retractions (red). (b) Cumulative fraction distribution plot of branch tip elongations (blue) and retractions (red) at 0–4d MD (left) and 4–7d MD (right) as compared to control (dotted lines) (* p <0.05). (c) Rate of dendritic branch tip elongations (blue) and retractions (red) in L1 and L2/3 of binocular visual cortex, before and during monocular deprivation. (n = 16 cells from 13 mice, L1: 228 branch tips. L2/3: 325 branch tips) (** p < 0.01, *p < 0.05). Error bars, s.e.m.

