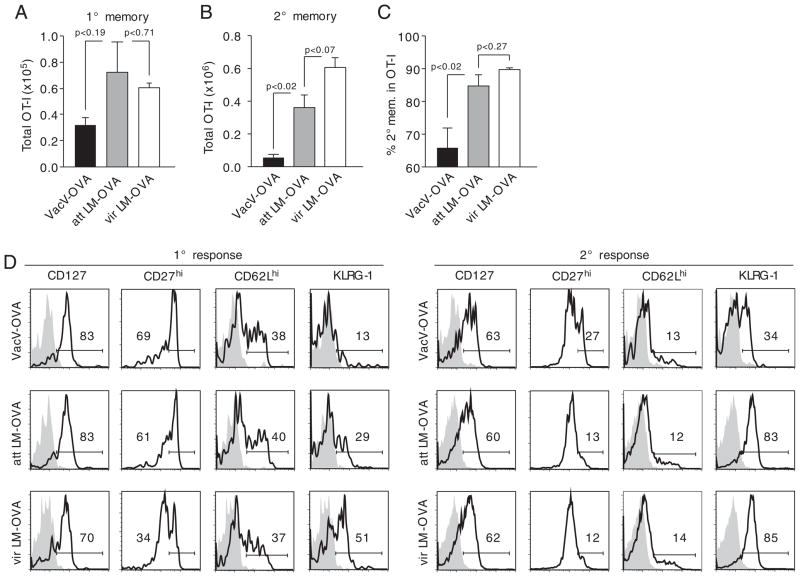
Figure 2.
Pathogens differentially impact the number and phenotype of 2° memory CD8+ T cells. (A) Mice from the experiment described in Fig. 1 were sacrificed on day 57 p.i. and total 1° memory OT-I cell numbers were analyzed in the spleen of up to five mice from each group. (B) Absolute numbers of 2° memory OT-I cells in the spleen. (C) Percentage of 2° memory OT-I cells in the total OT-I cell population. Bars show mean + SEM for each group. (D) Spleens of individual mice (n = 5/group) were pooled and the phenotype of 1° (left panel) and 2° (right panel) memory OT-I cells was analyzed. Numbers show the percentage of marker-positive OT-I cells, and shaded histograms represent isotype controls. Data are representative of two independent experiments.

