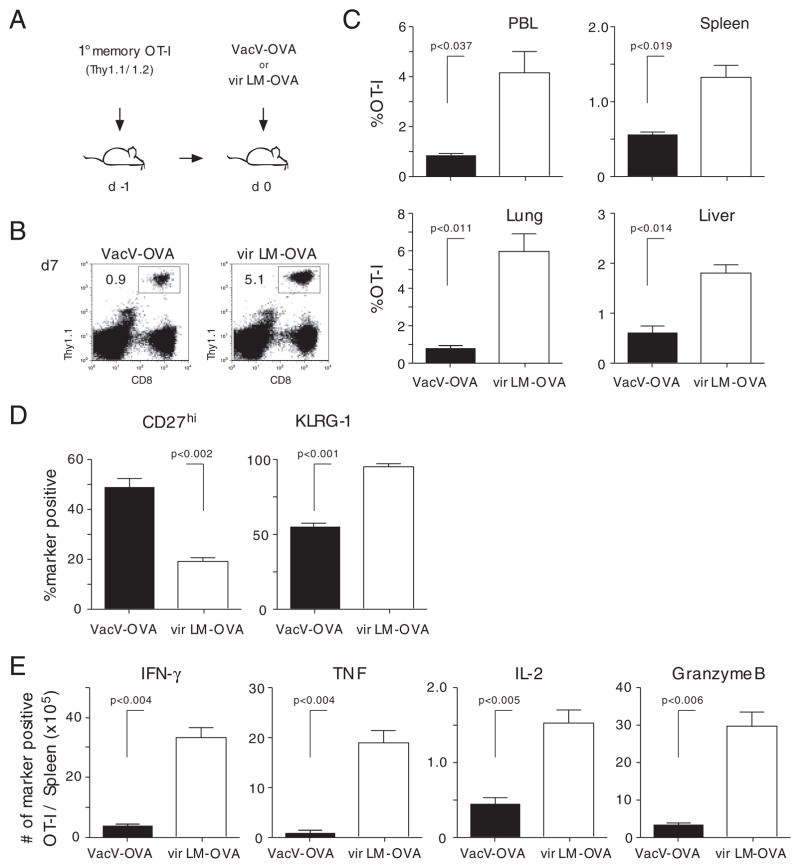
Figure 3.
Tissue distribution and function of 2° effector CD8+ T cells is pathogen dependent. (A) Experimental setup: 1° memory OT-I cells (1 × 10⁴) were injected into naïve Thy1.2 hosts. Mice were infected with 3 × 10⁶ PFU VacV-OVA i.p or 5 × 10⁴ vir LM-OVA i.v. (B) Thy1.1+ OT-I cells were identified in PBL 7 days p.i. Numbers show the percentage of the OT-I T-cell populations in the PBL population of representative mice. (C) Percentage of 2° effector CD8+ T cells in indicated organs 7 days p.i. Numbers show mean+SD (n = 4 mice/group). (D) The phenotype (CD27 and KLRG-1) of OT-I cells in the spleen. Bars show mean+SD. (E) Total number of cytokine- (IFN-γ, TNF, and IL-2) and Granzyme B-producing OT-I cells in the spleen after direct ex vivo OVA257–264-peptide stimulation. Bars show mean+SD.

